
4/17/2023
From Individual Goals to Population Change
Javier Mad Adell
At Kannact, we give every participant individual goals for each applicable health outcome that we track. Goals are very simple: for each outcome, the participant's goal for a given year is either to "improve" or "maintain", depending on their outcome in the previous year.
Our health outcomes map directly to HEDIS and MIPS scores. For example: blood pressure under 140/90. For someone with hypertension who, in 2021, had a blood pressure above 140/90, their goal is to "improve" and bring it under 140/90. For someone with hypertension who, in 2021, had a blood pressure under 140/90, their goal is to "maintain" and keep it under 140/90.
By making our goals conditional on the previous outcome, and tracking progress separately, we are able to compare our performance across very different populations and still get meaningful results. For example: a population that has been with Kannact for 4 years is very different from a population that just started last year.
Looking at the goal completion in a single year is a good method to understand the impact we’ve had on that year. However, a single-year analysis doesn’t describe the underlying long term trend. That's why we conducted a multi-year cohort analysis to better understand the long-term trends in health outcome compliance.
Our Cohort
Our cohort comprised all participants who were active for the first two or three years after enrollment and for whom we had HbA1c or BP screenings annually.
For HbA1c screenings, our cohort sizes were 40 for three years of activity, and 173 for two years of activity. For BP screenings, our cohort sizes were 59 for three years of activity and 357 for two years of activity.
Outcomes
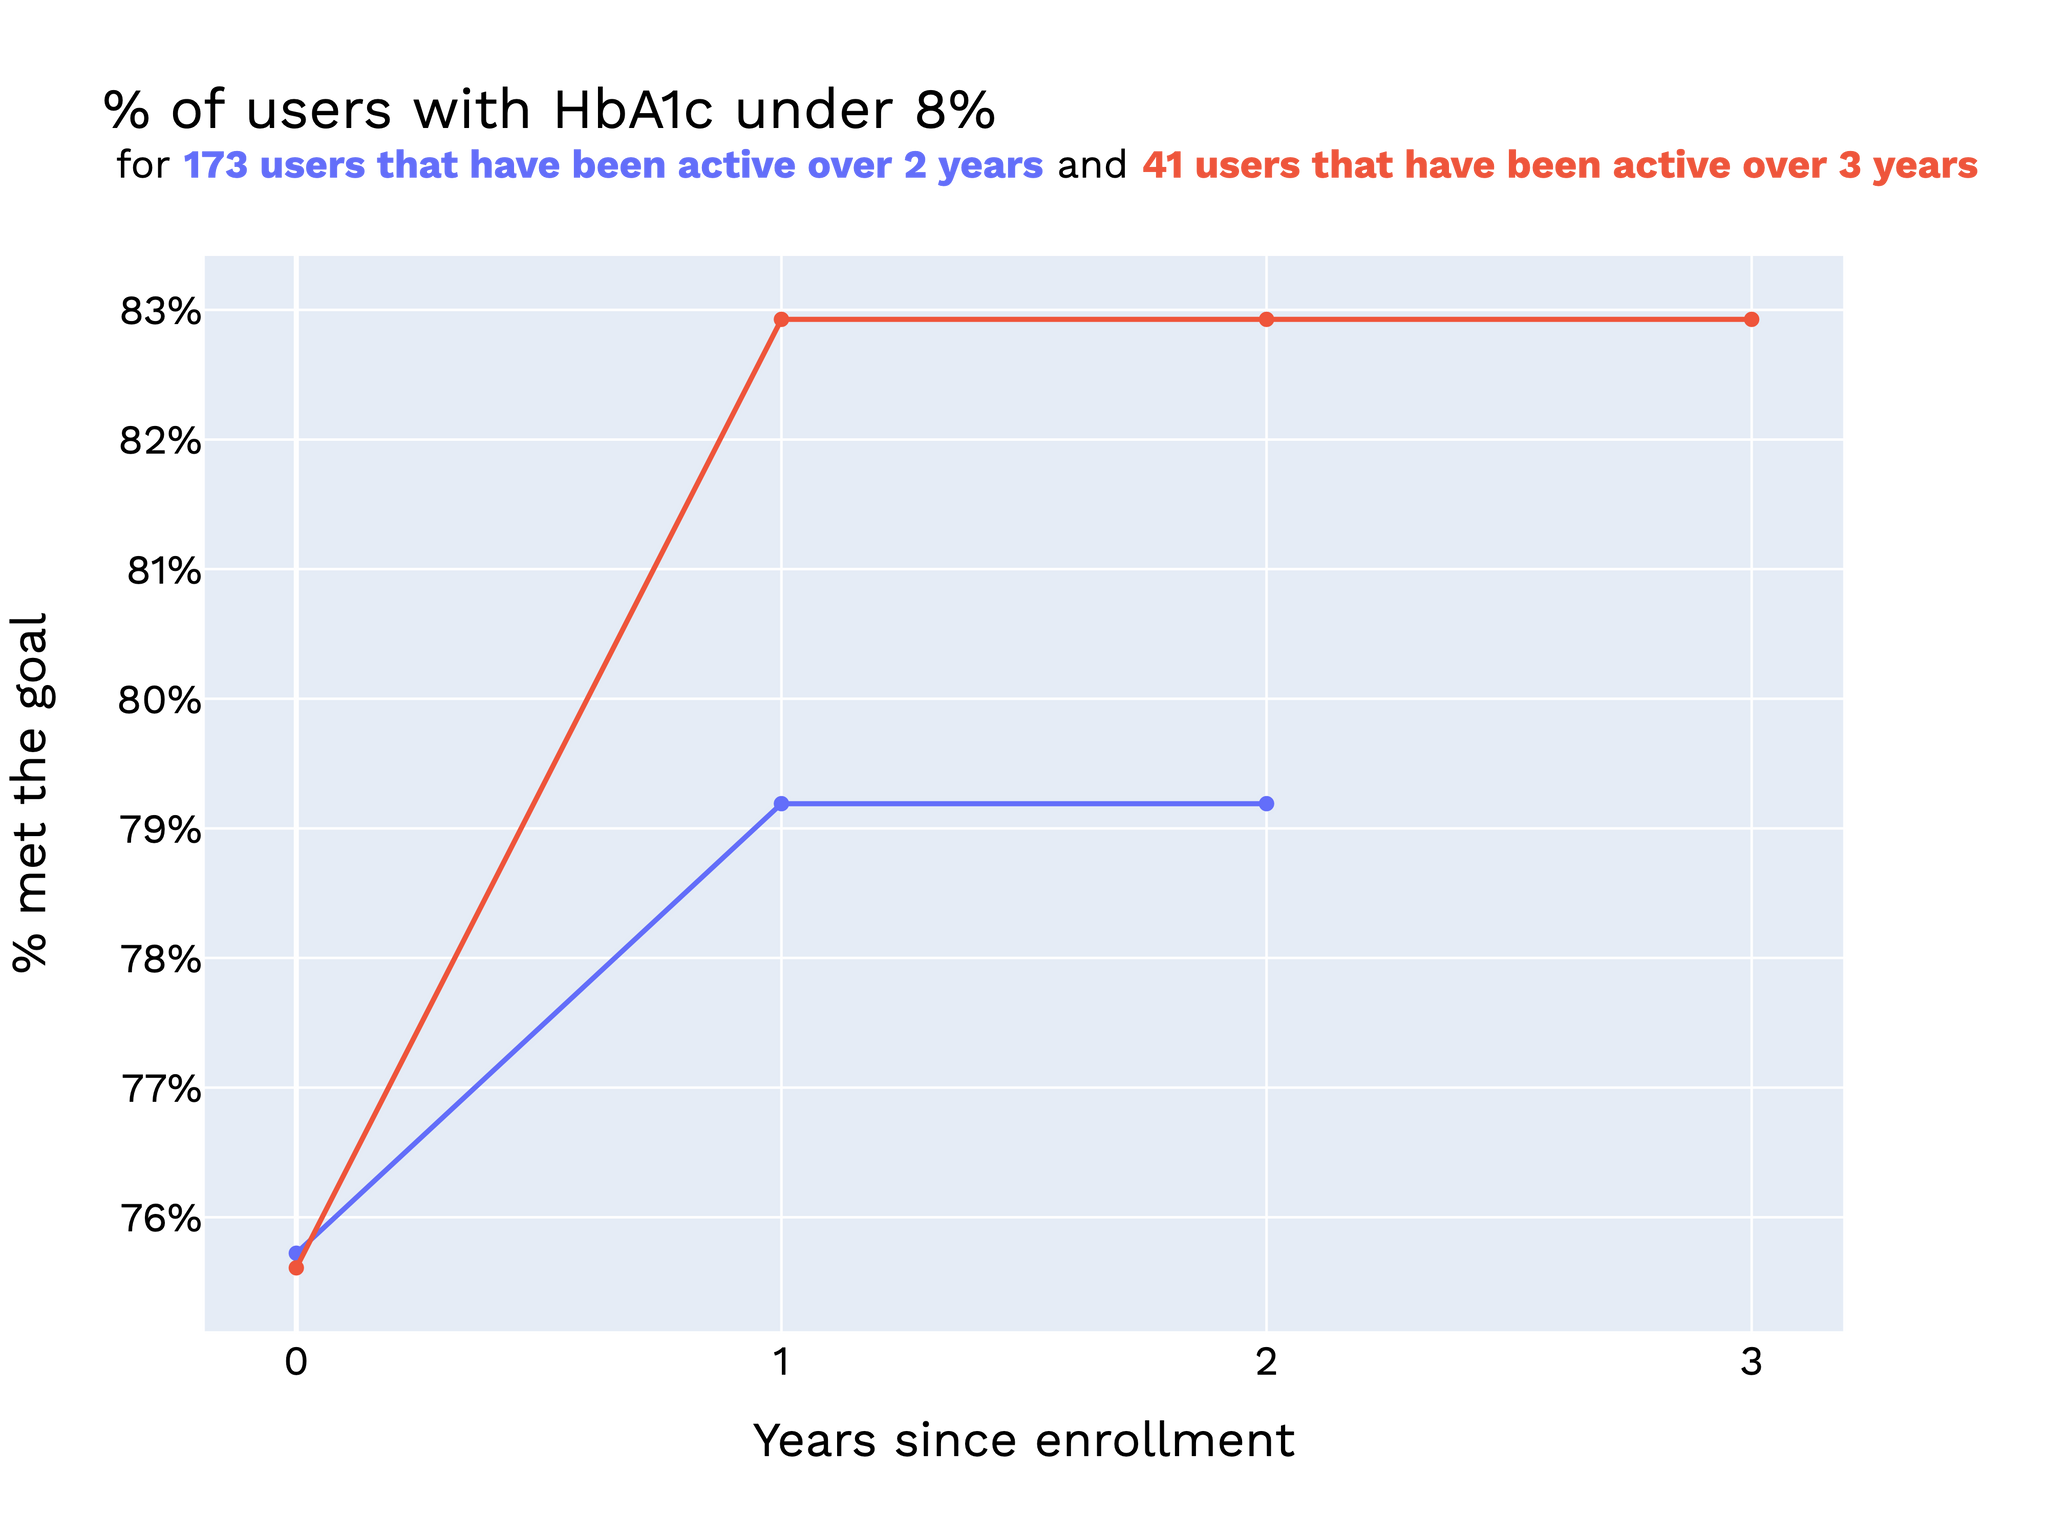
What do we see over time? In the 3-year cohort, the percentage of users controlling their HbA1c increased to 82.5% from 75%. In the 2-year cohort, the percentage of users controlling their HbA1c increased to 79% from 76%.
What about blood pressure?
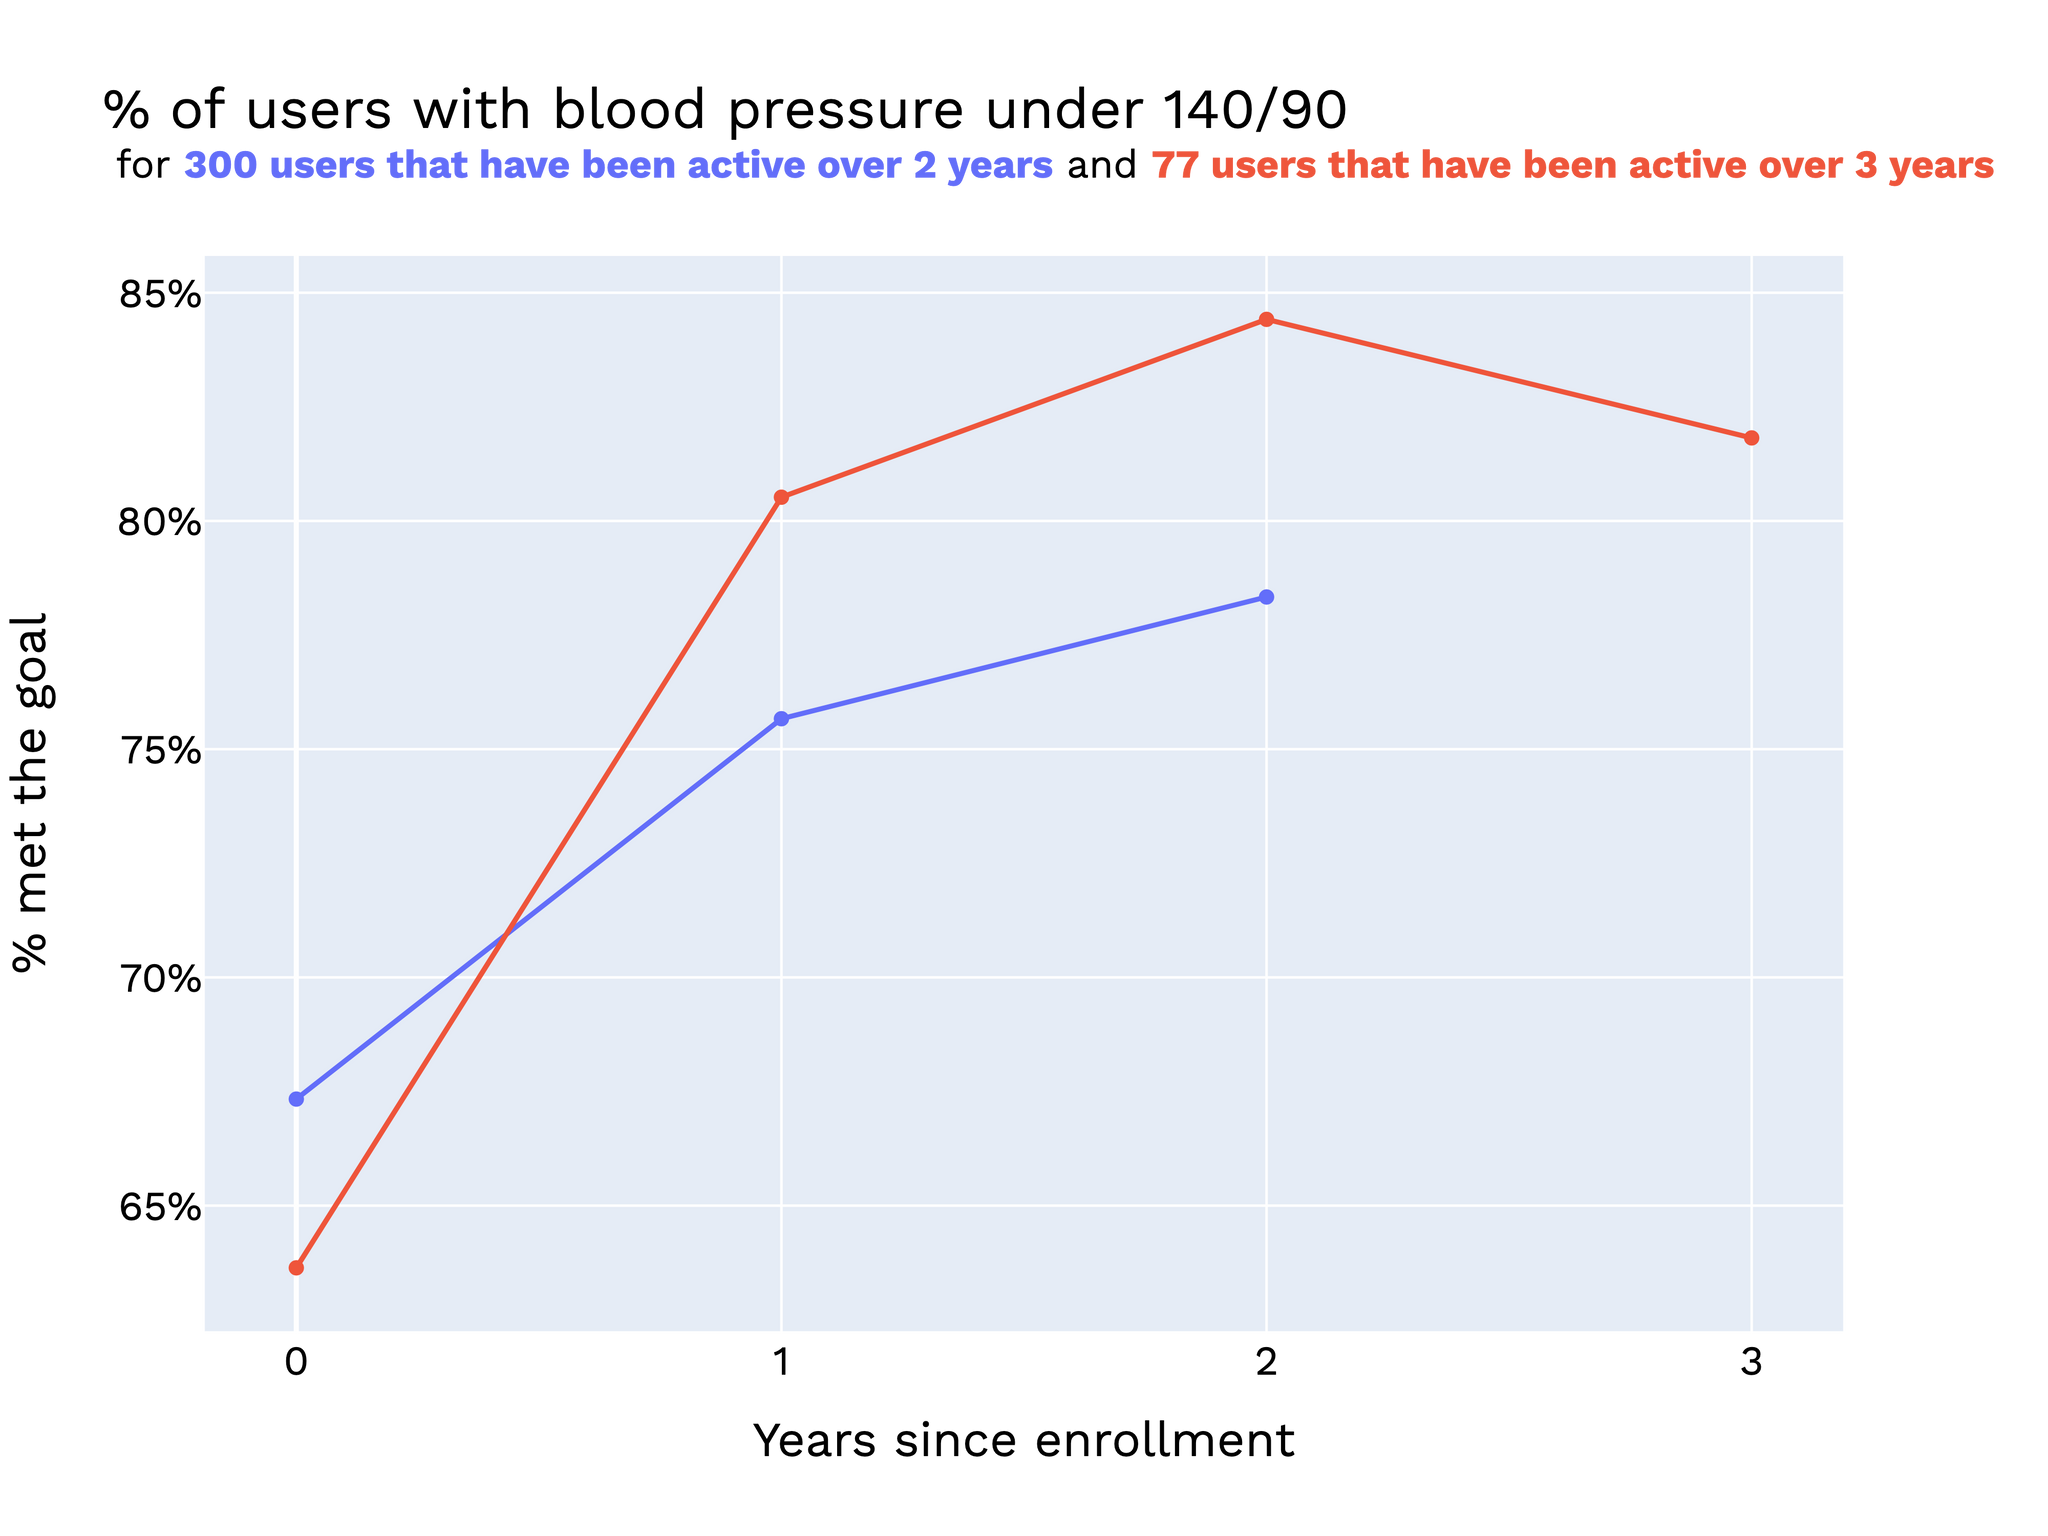
In the 3-year cohort, the percentage of users controlling their blood pressure increased to 81% from 64%. In the 2-year cohort, the percentage of users controlling their blood pressure increased to 78% from 68%.
Conclusions
Health outcomes improved over time for all cohorts and biometrics. Improvements in the first two years were consistent across both cohorts, although the HbA1c cohort showed a significant difference in the degree of improvement. The largest improvements occurred in the first year, with compliance plateauing over time as users who achieved a healthier state maintained it.
This pattern of improvement-then-plateau is exactly what we would expect if we had a consistent success rate for "improve" goals and a consistent success rate for "maintain" goals. This is a strong validation of the goals-based approach and emphasizes the need for both "improve" as well as "maintain" goals. The success of the maintain goals is what allows the population, after several years of working with their health coaches, to settle into an improved equilibrium population health state that is better than it was before they started working with Kannact.